Currently Empty: 0 $
Beyond the Pilot: The Operational Architecture of Smart Cities
The era of “smart city” experimentation is over. For the last decade, municipal leaders have collected pilot projects like trophies—isolated smart streetlights, standalone parking apps, and dashboard silos that look impressive but fail to talk to one another.
Today, the mandate has shifted from experimentation to integration. The cities winning the future are not those with the most sensors, but those with the most coherent Urban Operating Systems (UOS).
Here is a strategic breakdown of how to move from a collection of gadgets to a unified, cognitive city.
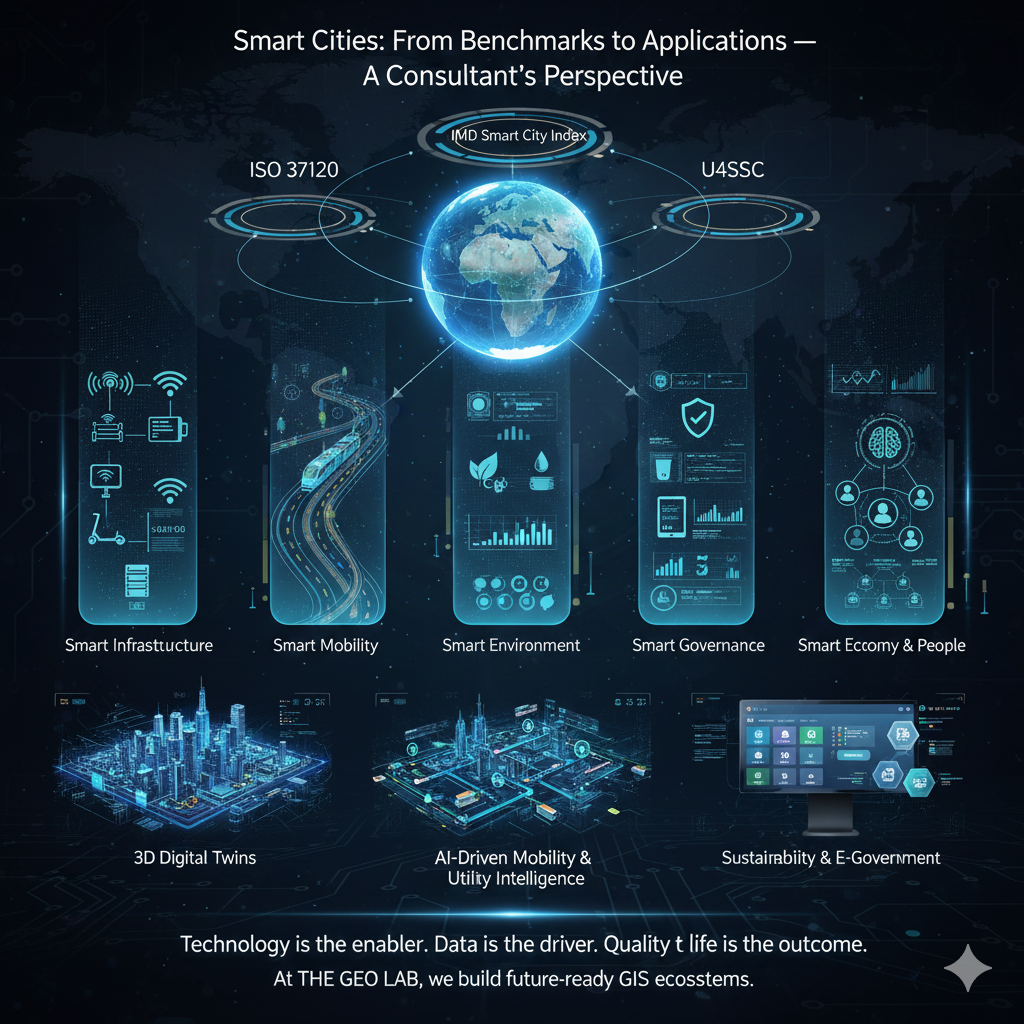
1. Benchmarking 2.0: The “Perception vs. Performance” Gap
A common pitfall in smart city strategy is relying on a single metric to define success. A truly data-driven baseline requires a “bifocal” approach that measures both hard infrastructure performance and soft citizen sentiment.
-
ISO 37120 (The Engineer’s View): This is your System of Record. It provides standardized quantitative KPIs (e.g., fine particulate matter (PM2.5) concentrations, water loss percentage, emergency response times). It tells you how the city is performing.
-
IMD Smart City Index (The Citizen’s View): This is your System of Engagement. It measures the perception of residents.1 A city might have excellent high-speed rail (high ISO score), but if citizens feel unsafe using it at night, the IMD score drops.
Consultant Insight: The “Smart Gap” is the difference between these two. If ISO scores are high but IMD scores are low, you have a communication and trust problem, not a technology problem.
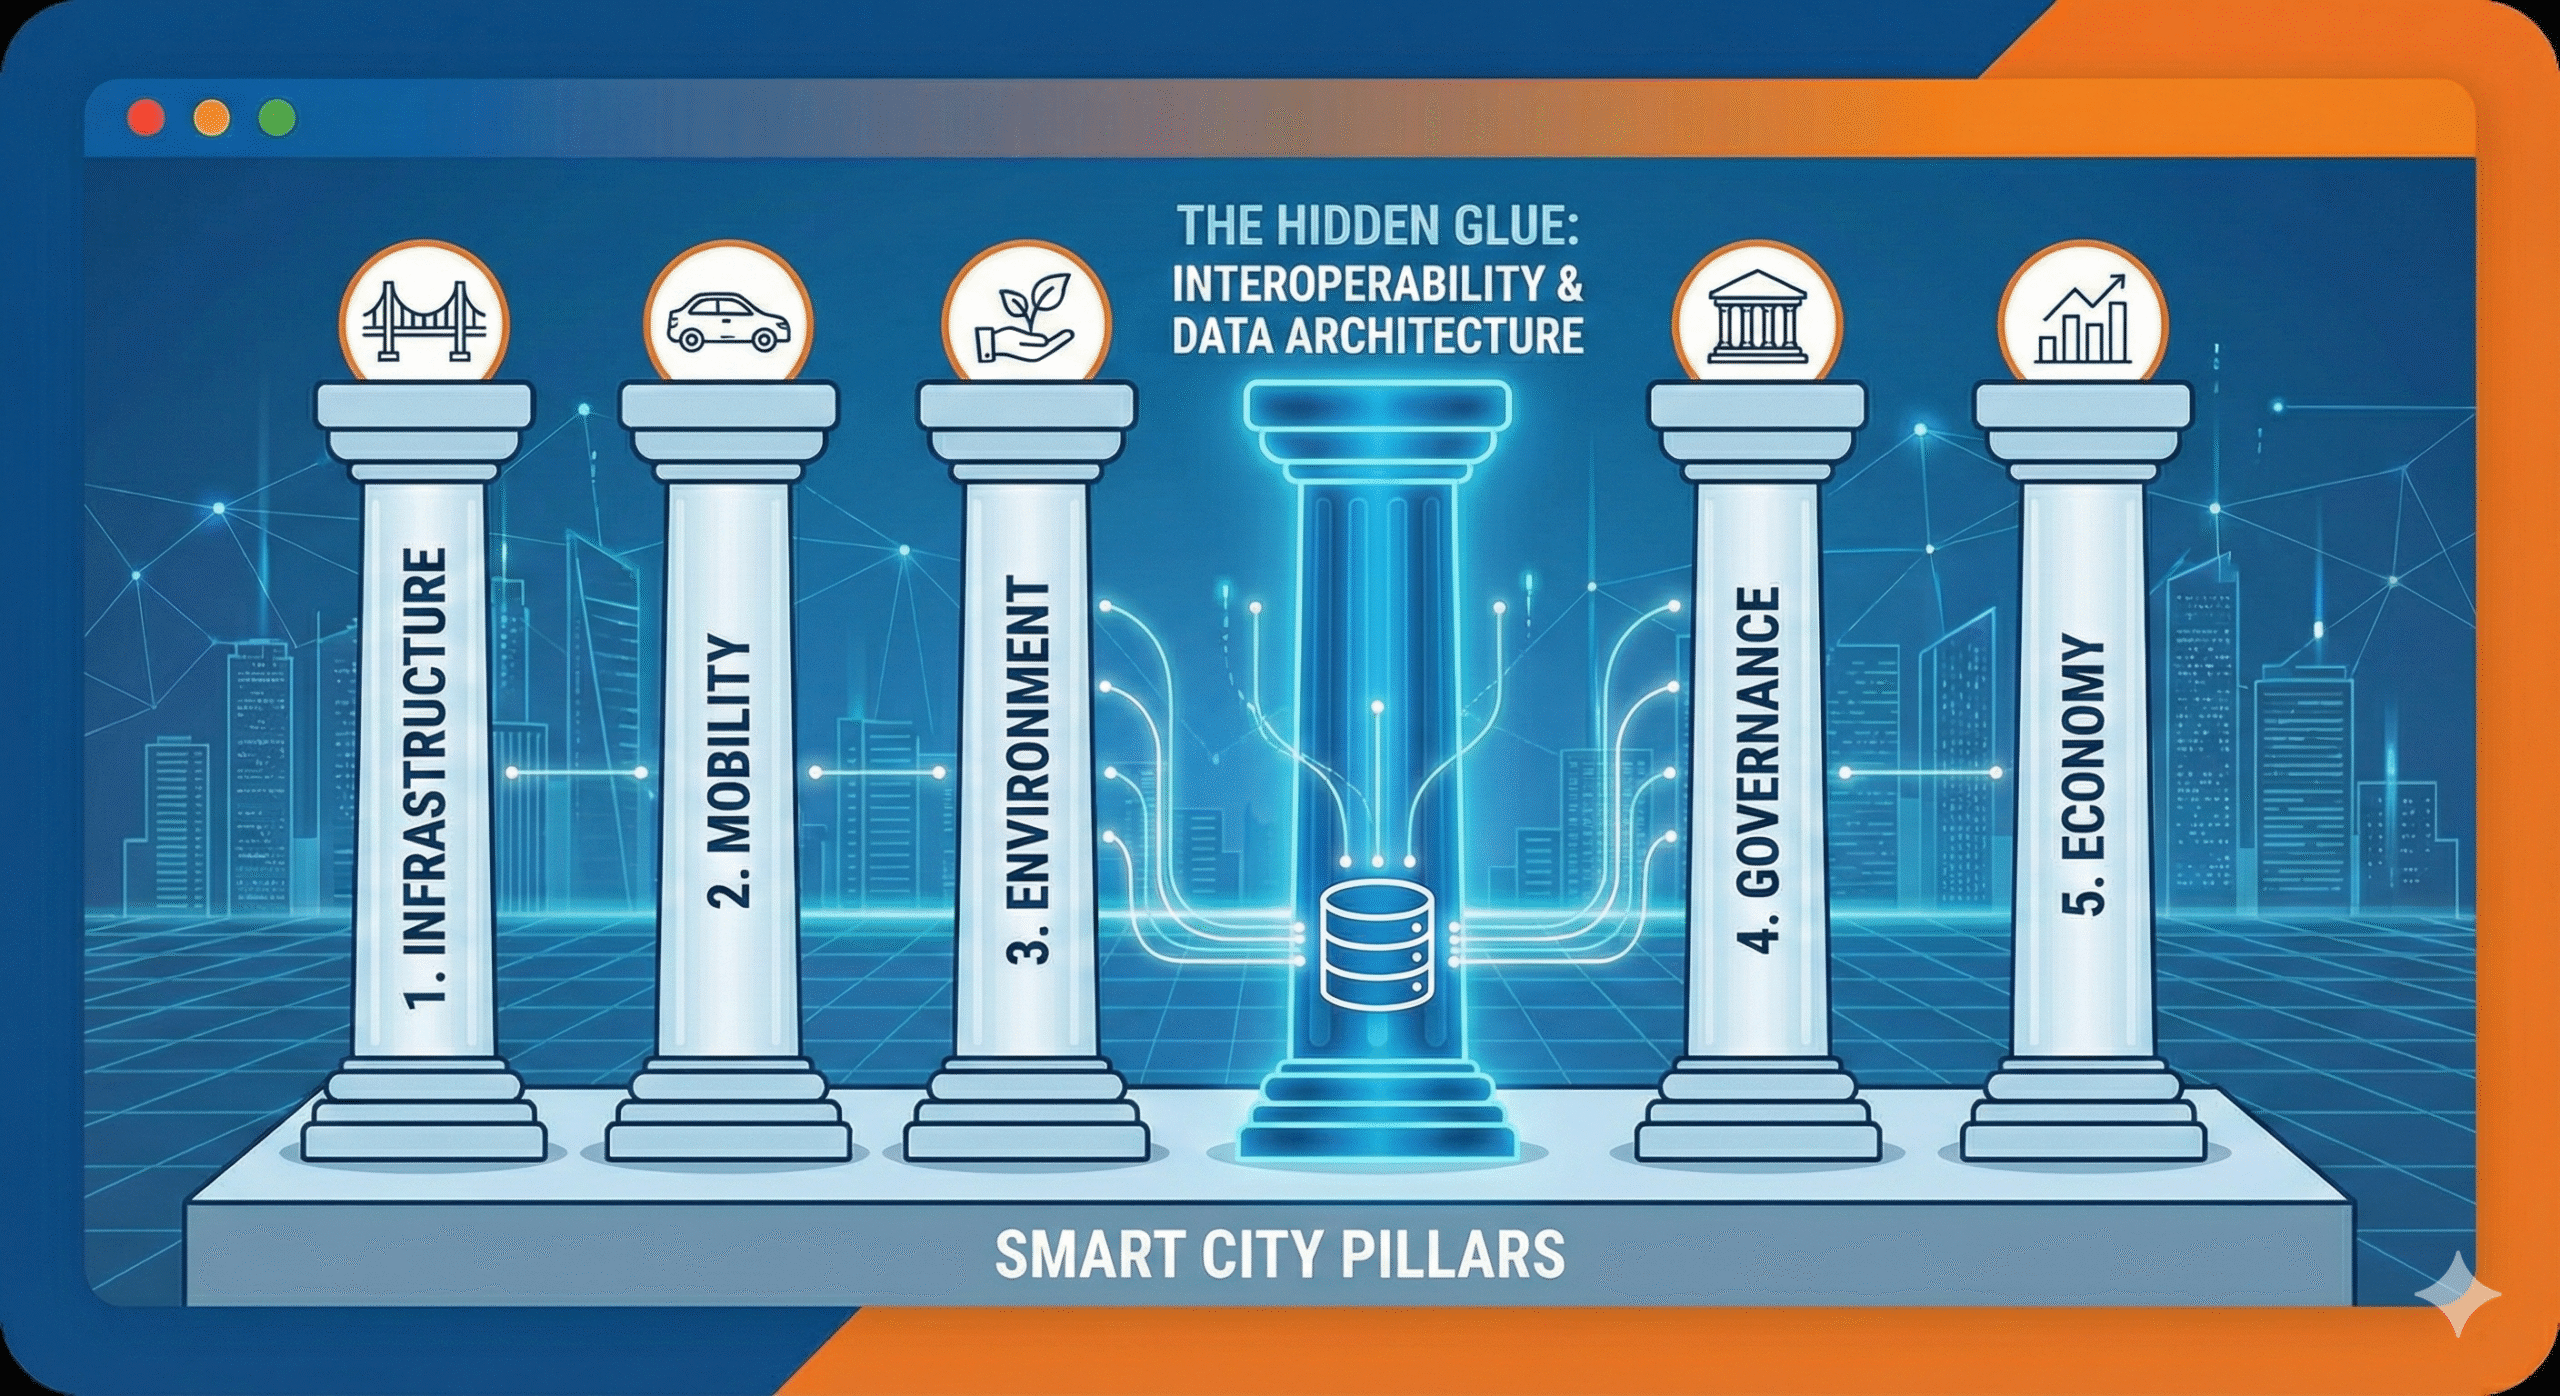
2. The Structural Foundation: The 5 Pillars + The Hidden Glue
While the standard five pillars (Infrastructure, Mobility, Environment, Governance, Economy) remain relevant, they are useless without the “hidden” sixth pillar that holds them together: Interoperability & Data Governance.
-
Smart Infrastructure: Moving beyond connectivity to “Self-Healing Assets.” Sensors should not just report a leak; they should trigger work orders in the asset management system automatically.
-
Smart Mobility: The shift from “tracking” to “predicting.” It is not about knowing where the bus is; it is about an AI model adjusting traffic light phasing 15 minutes before congestion peaks.
-
Smart Environment: From monitoring to mitigation. Advanced cities use “Cognitive Digital Twins” to simulate heat waves and automatically adjust building energy consumption across a district to prevent grid failure.
-
Smart Governance: The transition from “E-Government” (digitized forms) to “Proactive Governance” (services that find you). Example: A permit renewal notification sent automatically because the system “knows” your license is expiring.
-
The “Hidden Glue” (Data Architecture): Successful cities build a Unified Data Lake that ingests data from all pillars. Without this, you are just building faster silos.
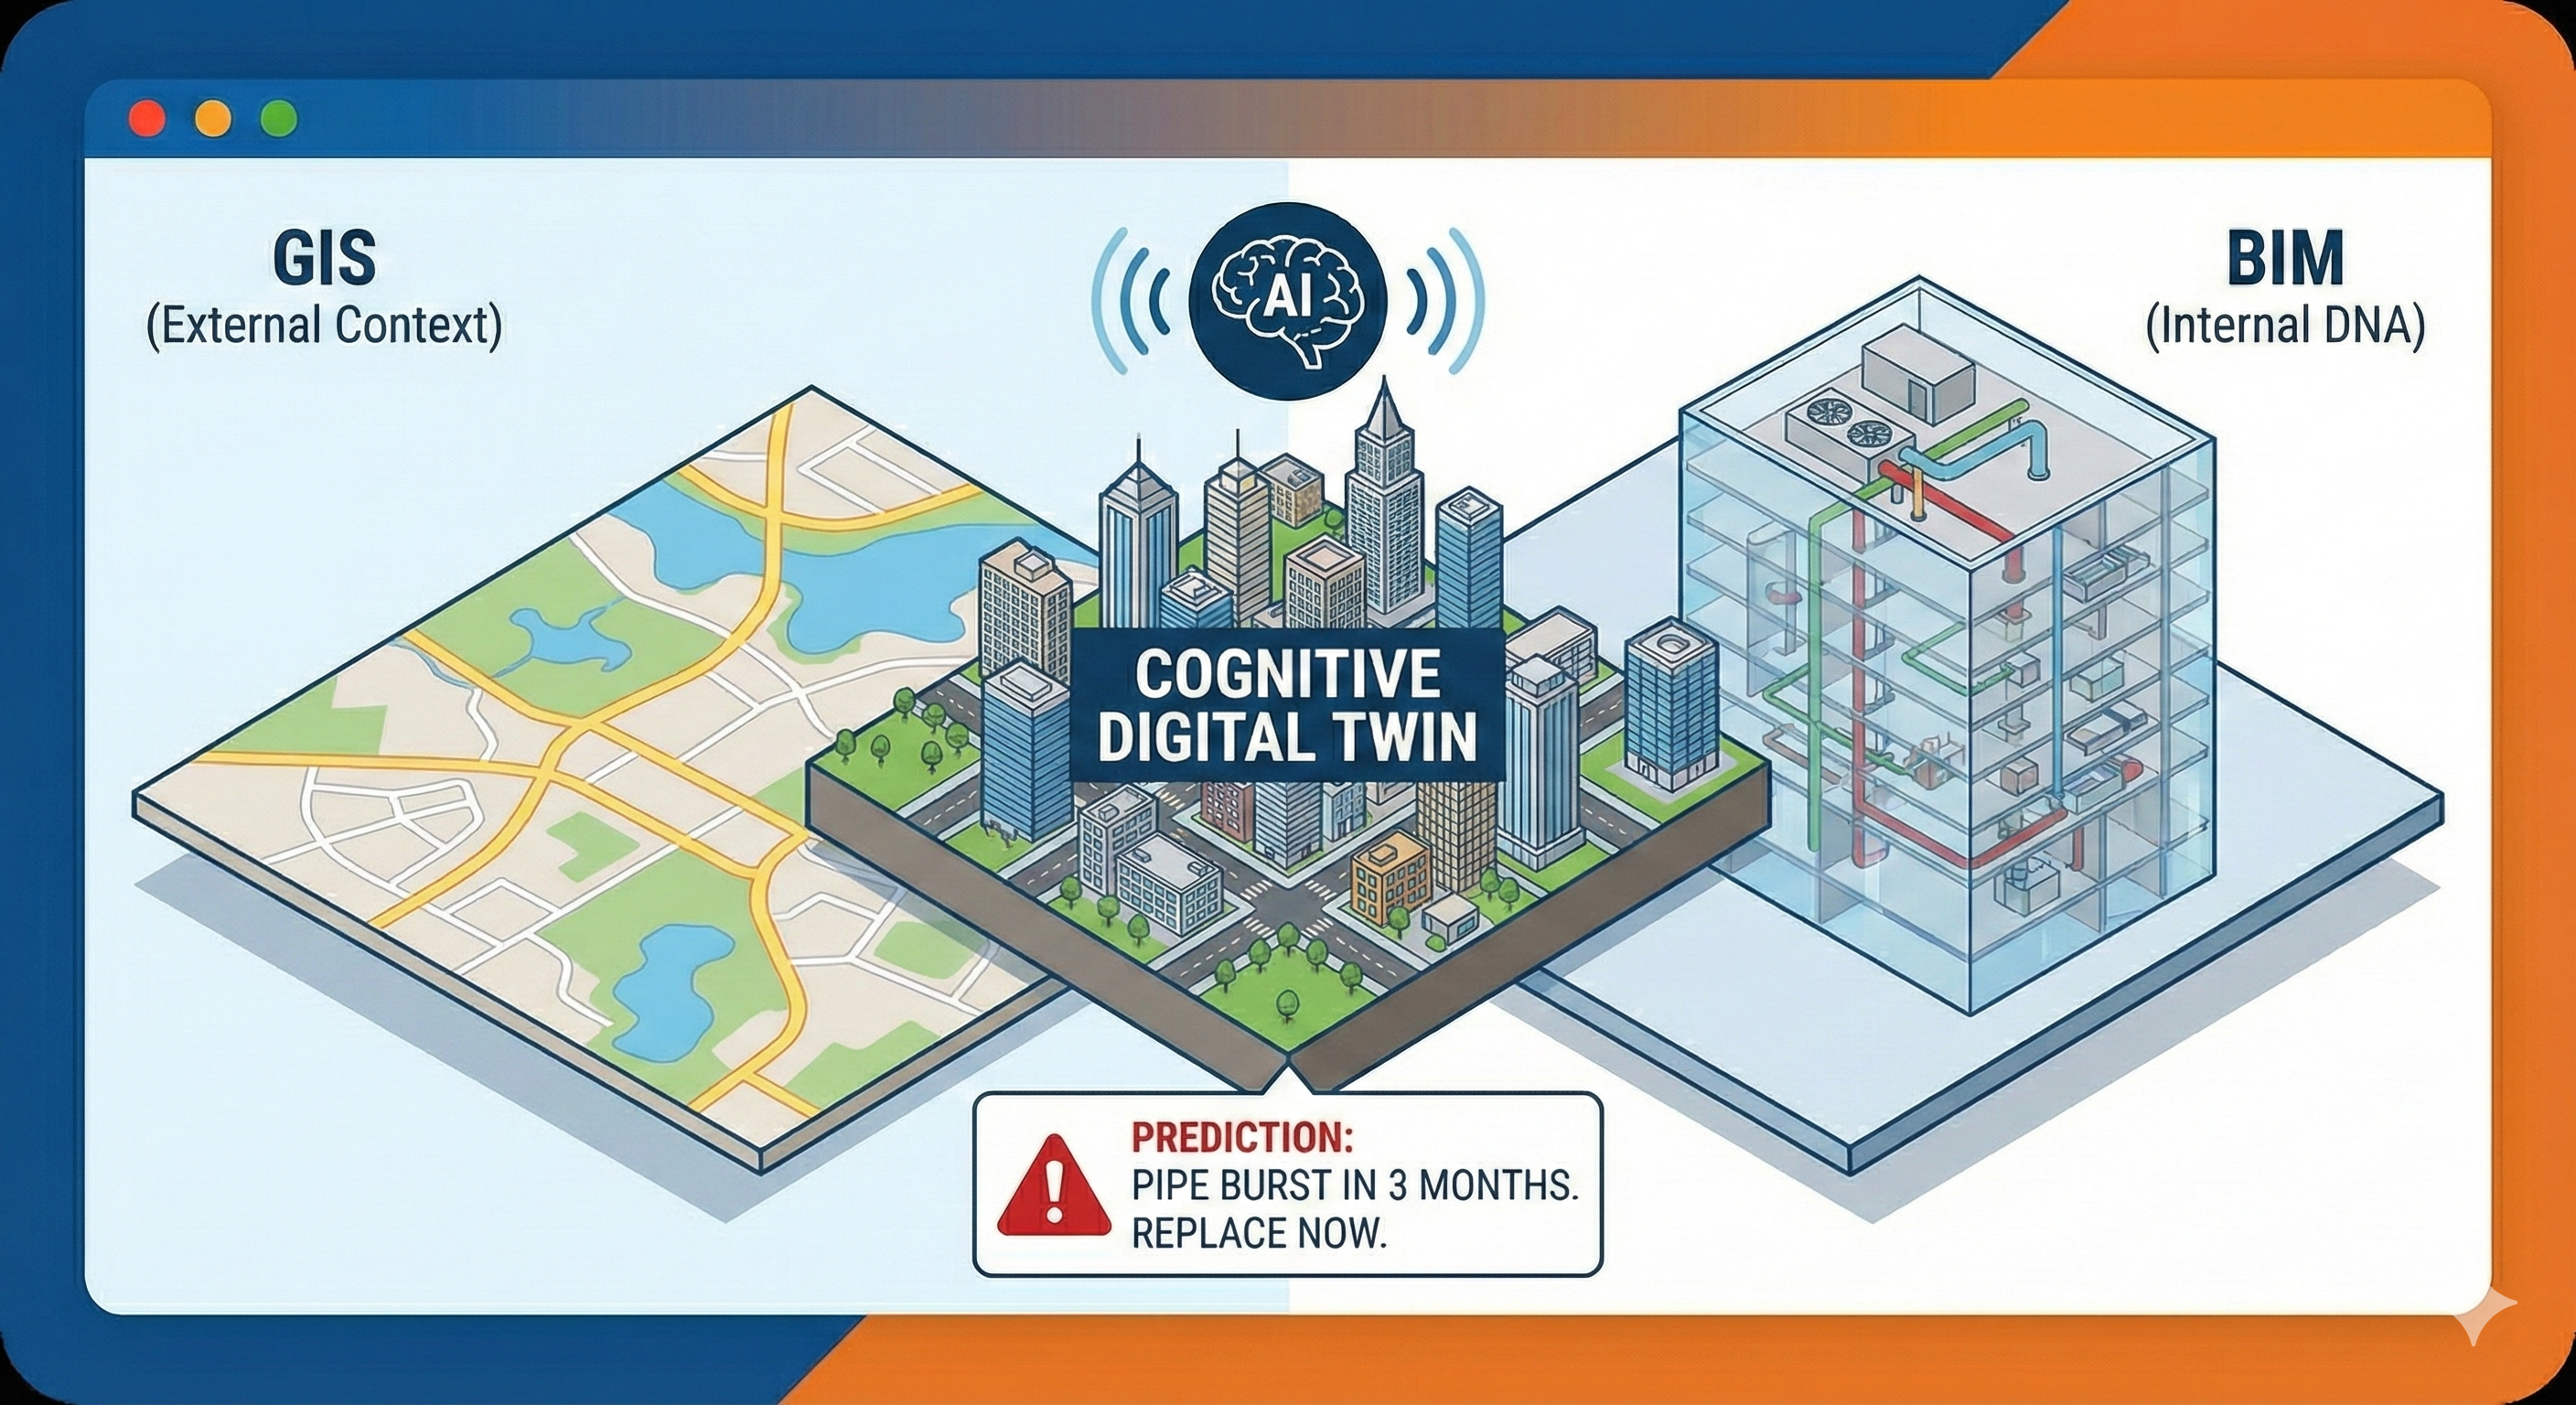
3. The New Application Standard: Cognitive Digital Twins
The buzzword “Digital Twin” is often misused to describe simple 3D models. A true, operational Digital Twin is a decision-support engine that fuses two critical data streams:2
-
BIM (Building Information Modeling): The detailed “internal” DNA of physical assets (materials, HVAC systems, floor plans).
-
GIS (Geographic Information Systems): The “external” context (location, environment, traffic flow, flood zones).
The Maturity Ladder of Digital Twins:
-
Level 1 (Descriptive): A 3D map that shows what happened. (e.g., “A pipe burst here.”)
-
Level 2 (Diagnostic): Real-time monitoring that shows what is happening now. (e.g., “The pipe is leaking at 50 liters/minute.”)
-
Level 3 (Predictive/Cognitive): AI models that show what will happen. (e.g., “Based on soil acidity and pipe age, this pipe will burst in 3 months. Replace it now.”).
4. The Implementation Trap: Why Strategies Fail
Most smart city roadmaps die in the “Valley of Death” between the Pilot Phase and Enterprise Scale.
| The Pilot Trap | The Enterprise Scale Approach |
| Vendor-Led: “Let’s buy this cool sensor.” | Problem-Led: “Let’s reduce commute times by 10%.” |
| Siloed Data: Data stays in the vendor’s dashboard. | Open Data: Data flows into a city-owned platform. |
| CapEx Heavy: Buying expensive hardware. | OpEx Optimized: Focusing on software/analytics value. |
| Tech-First: “Where do we put the IoT?” | Process-First: “How do we change the workflow?” |
Strategic Takeaway: You cannot buy a smart city; you have to build the capacity for one. This requires investing in people and processes just as much as technology.
Conclusion: The City as a Service
The ultimate goal of a smart city is not to be “digital”—it is to be invisible.
When the trash is collected before it smells, when the traffic light turns green just as you arrive, and when a permit is approved before you worry about it—that is a smart city. The technology fades into the background, leaving only the outcome: a higher quality of life.
At The GEO LAB, we help leaders navigate this complexity. We don’t just deliver maps or apps; we design the interoperable architectures and governance frameworks that turn isolated pilots into sustainable, city-wide engines of growth.
Related Posts